
Breadcrumb
Netglare: For Business Owners – The Difference Between 'We Had Downtime' And 'We Know
Uptime monitoring for business owners is one of those problems that feels solved the moment you sign up for a tool that sends you an alert when your site goes down. You get the notification, you call your team, they fix it, life goes on. Problem solved. Except it isn't, because three months later the same thing happens again and you're back in the same conversation wondering why your infrastructure keeps surprising you at the worst possible moments.
The alert isn't the solution. It's just the beginning of the problem.
The Cost You Can't See
When your site goes down, you know something bad happened. What you probably don't know is exactly how bad. How much revenue did you lose in those fifteen minutes? Was it $500? $5,000? $50,000? Most business owners have no idea because their uptime monitoring tool tells them when the site went down and when it came back up but nothing about what happened in between in business terms.
That's the first thing uptime monitoring for business owners should change: visibility into what downtime actually costs you. Not industry estimates or generic averages. Your actual number, your actual infrastructure, your actual losses calculated from your real traffic and revenue patterns. Once you can see what downtime costs, you start asking different questions. If downtime costs your business $10,000 per hour, investing in better monitoring stops being a cost centre and starts being the cheapest insurance policy you've ever bought.
The Recurring Problem Nobody Fixes
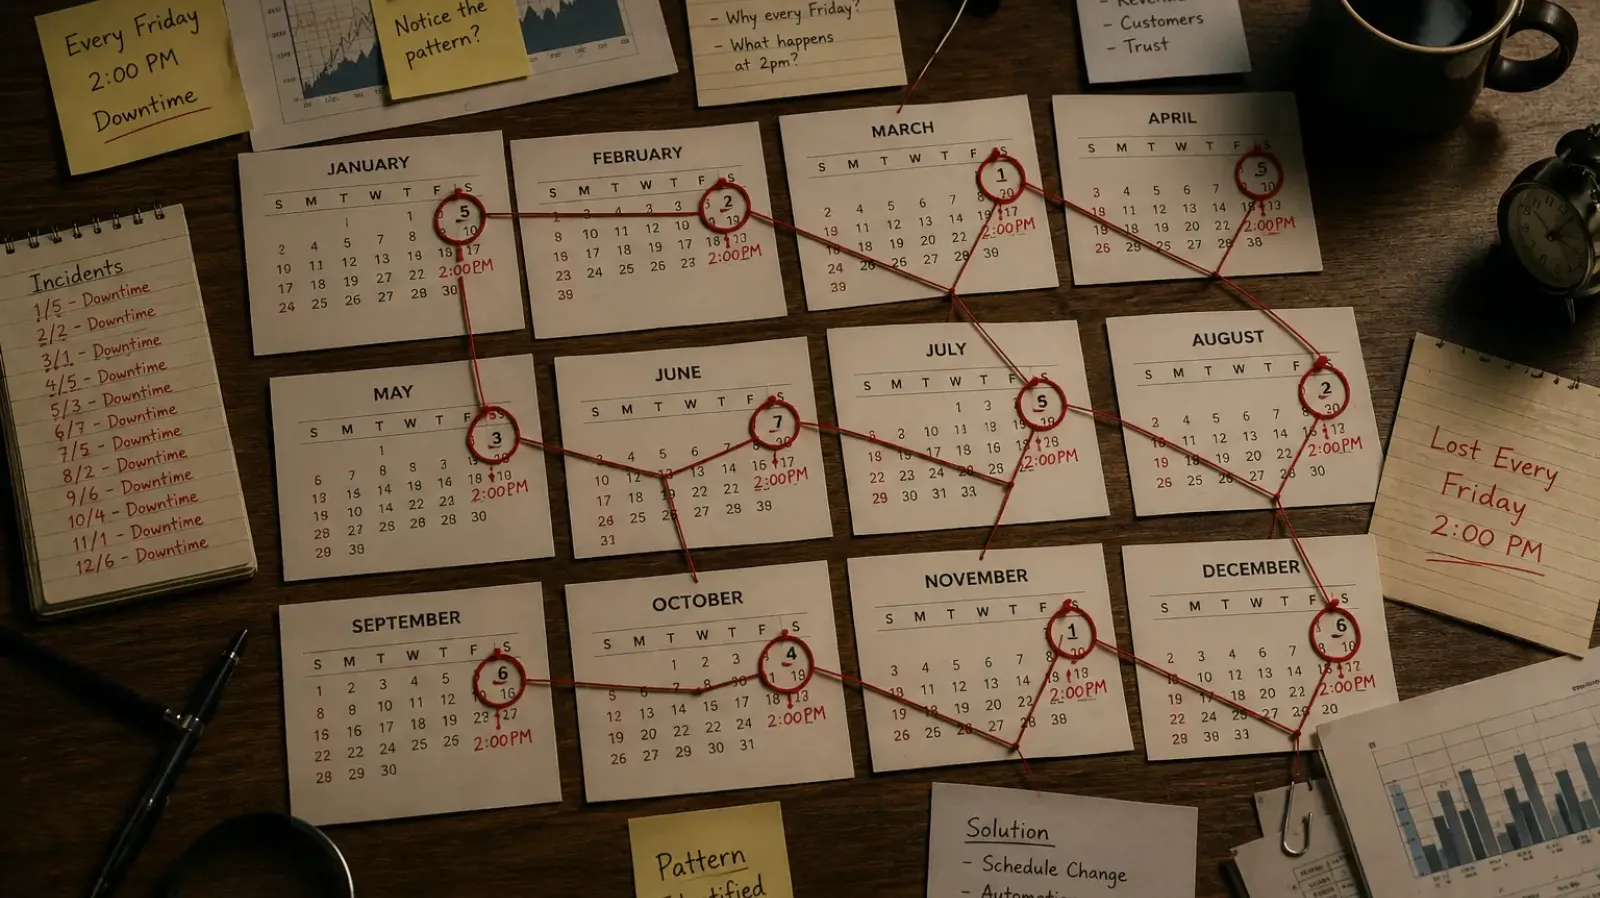
Then there's the pattern. The incident that keeps happening every Friday at 2pm or every time you launch a new feature or every time traffic spikes beyond a certain threshold. You fix it, it happens again, you fix it again, it happens again. You're on a treadmill and you don't even realize it because your monitoring tool treats every incident as a new event with no connection to the ones before it.
Most uptime monitoring tools work exactly like this. Something happens. Alert fires. You investigate. You fix. The tool resets and waits for the next thing to happen. No memory of what came before. No pattern recognition. No connection between last Friday's incident and the one three weeks ago that looked exactly the same. Just a series of isolated alerts that never add up to the insight that would actually break the cycle.
Netglare groups related alerts into single incidents so you see the problem instead of forty seven notifications telling you about the consequences of the problem. The longer you use it, the more it understands your infrastructure. It learns what normal looks like for your specific endpoints, what stressed looks like, and what the early warning signs of a recurring issue look like before it becomes a full incident. Every Monday morning it compiles that week's performance into a digest that reaches everyone who needs to understand infrastructure health without logging into a dashboard. That accumulated understanding is what turns uptime monitoring for business owners from a reactive alert system into a proactive intelligence layer.
The Competitive Advantage Nobody Talks About
Here's what separates businesses that compete on reliability from businesses that just hope for the best: understanding. The ones winning understand their infrastructure deeply enough to prevent most problems before they happen. They know when maintenance windows will impact revenue and when they won't. They know which issues are critical and which are just noise. They know their baseline so well that when something genuinely breaks, they catch it immediately and understand what it means in business terms before their customers notice anything is wrong.
That's not luck and it's not a bigger budget. That's pattern recognition built on accumulated data about how your business actually runs. Most businesses never get there because they're too busy reacting to downtime to step back and understand it. They fix the immediate problem and move on. Rinse, repeat, bleed money.
What Changes With Netglare
Uptime monitoring for business owners should do three things well. It should tell you immediately when something breaks. It should show you what that costs you in real business terms. And it should help you understand the patterns underneath your incidents so you can solve them once instead of patching them forever.
With Netglare, you stop flying blind. You move from "downtime happened, we reacted" to "we understand our infrastructure well enough to prevent most of this." You get to see the patterns, understand the recurring problems, and make informed decisions about infrastructure investment based on actual cost data rather than gut feel. And maybe most importantly, you get to compete on reliability because you actually understand yours.
Head to netglare.com and sign up for a trial. Create your first monitor for a critical endpoint and watch what happens over the next week. You'll probably notice patterns you didn't know were there. Maybe you'll realize that incident you thought was random actually happens on a schedule. Maybe you'll finally quantify what that Friday afternoon outage actually costs your business. Either way, you'll have data you didn't have before.
Or if you want to talk through your specific situation first, reach out at getstarted@gatoblan.co. We built Netglare because we got tired of watching businesses treat preventable problems like they're inevitable.