
Breadcrumb
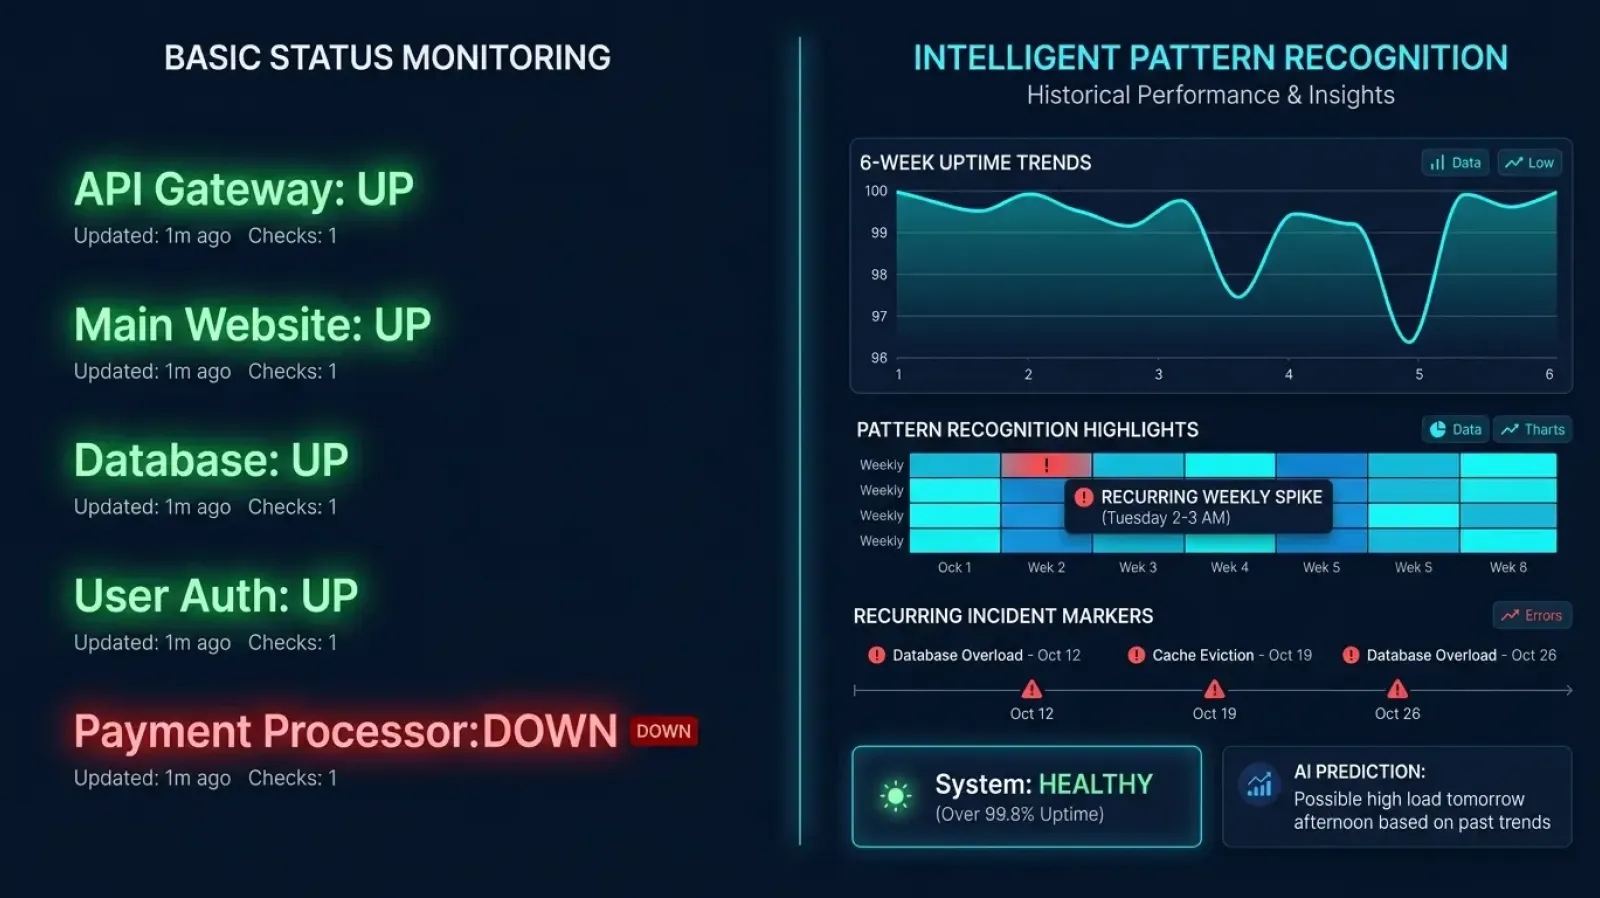
The Difference Between Knowing Your Site Is Down And Understanding Why It Matters
Website downtime monitoring is one of those problems every business thinks they've solved because they signed up for a tool that sends them an alert when something breaks. Datadog does it, PagerDuty does it, New Relic does it, UptimeRobot does it. Every monitoring tool on the market will tell you when your site is down. So if every tool does the same thing, what's actually the difference between them?
The difference is what happens after the alert.
The Alert Is The Beginning, Not The Answer
When your e-commerce site goes down on a Friday afternoon during peak traffic, the alert is the least useful part of the experience. You already know something is wrong because your customers are tweeting about it and your revenue dashboard looks like it's having an existential crisis. What you actually need to know is whether this is a new problem or the same problem that's been quietly recurring every Friday at 2pm for the past three months while your team patches it and moves on without ever understanding why it keeps happening.
Most website downtime monitoring tools give you the alert and stop there. They tell you the site is down, they tell you when it came back up, and they leave the rest of the investigation to you. That's useful for about thirty seconds. After that you're manually digging through logs, trying to reconstruct a timeline from memory, and hoping the pattern that caused this incident will somehow be obvious from the evidence available in the immediate aftermath of something breaking.
It usually isn't. And that's the problem.
What Website Downtime Monitoring Should Actually Do
When your site goes down, you need to know three things. First, that it's down and when it happened. Second, what it's actually costing you in real business terms while it stays down. Third, whether this is a new incident or a recurring pattern you've been reacting to without ever solving. Most monitoring tools give you the first one reliably. Some give you the first two with varying degrees of accuracy. Very few give you all three in a way that actually changes how you respond to incidents.
Netglare is built around the third question because that's the one that determines whether you fix the problem or just patch the symptom. It groups related alerts into single incidents so you see the problem instead of forty seven notifications telling you about the consequences of the problem. The longer you use it, the more it understands your infrastructure. It learns what normal looks like for your specific endpoints, what stressed looks like, what the early warning signs of a recurring issue look like before it becomes a full incident. That accumulated understanding is the difference between website downtime monitoring that reacts to problems and website downtime monitoring that helps you understand them well enough to prevent them next time.
The Pattern You're Missing
Here's what we've observed across years of building and managing infrastructure for clients: most recurring incidents aren't random. They follow patterns that are invisible when you're looking at real-time dashboards but obvious when you have weeks of historical performance data to compare against. The database that struggles every time a batch job runs at midnight. The API that degrades when traffic hits a specific threshold that happens to coincide with your peak business hours. The endpoint that's been running at 95% of its capacity for three months and is one traffic spike away from failing completely.
These patterns exist in your infrastructure right now. Website downtime monitoring that only shows you current state will never surface them. Monitoring that accumulates historical data, tracks performance trends over time, and learns your baseline will surface them before they become incidents that cost you revenue and reputation.
What This Looks Like In Practice
When Netglare monitors your infrastructure, it's not just checking whether your endpoints are responding. It's building a picture of how they respond under different conditions over time. Response times across weeks rather than moments. Uptime trends across months rather than days. Every Monday morning it compiles that week's performance into a digest that reaches everyone who needs to understand infrastructure health without logging into a dashboard. Incident patterns that reveal whether you're dealing with a new problem or a recurring one. Status classifications that tell you whether an endpoint is healthy, degraded, or critical based on its historical behavior rather than just its current state.
The result is website downtime monitoring that tells you what happened, what it cost you, and why it keeps happening. That's a different kind of intelligence than getting an alert and starting an investigation from scratch every time something breaks.
The Difference That Actually Matters
Most businesses treat downtime as an inevitable cost of running infrastructure. Something happens, they react, they fix it, they move on. The cycle repeats because nobody ever gets far enough from the immediate incident to understand the pattern underneath it. Website downtime monitoring should break that cycle, not just document it.
That's what we built Netglare to do. Not another alert machine, but an infrastructure layer that gets smarter the longer you use it, surfaces the patterns that recurring incidents hide, and gives you the kind of historical context that turns reactive incident response into proactive infrastructure management.
Head to netglare.com to see what your infrastructure patterns look like. Or reach out directly at getstarted@gatoblan.co if you want to talk through your monitoring setup. Understanding why your site goes down is more valuable than knowing when it does.